I’m proud to tell you that the project I worked on last year with Topomancy for the Library of Congress and the New York Public Library has just been released to the Internet. It’s an open source, fast, temporal enabled, versioned gazetteer using open data. It also works as a platform for a fully featured function-laden historical gazetteer.
You can check out the official release at the Library of Congress’s GitHub page, and for issues, documentation and development branches on Topomancy’s Gazetteer project site.
Here is an introduction to the project giving an overview and discussion of the challenges and listing the features of this software application. Enjoy!
DEMO: Head over to http://loc.gazetteer.us/ for the Digital Gazetteer – a more global gazetteer and to http://nypl.gazetteer.us/ for the NYPL’s NYC focused historic gazetteer. If you want to try out the conflation, remediation and administrative roles, let us know at team@topomancy.com
Introduction, Overview, Features
A gazetteer is a geographic dictionary sometimes found as an index to an atlas. It’s a geographic search engine for named places in the world. This application is a temporal gazetteer with data source remediation, relations between places and with revisions which works with many different data sources. It’s fast, written in Python and uses ElasticSearch as a database. The application was primarily written as a Digital Gazetteer for the Library of Congress’s search and bibliographic geographic remediation needs and was also developed for the New York Public Library’s Chronology of Place project. It is currently being used in production by the Library of Congress to augment their search services. The software is MIT licensed.
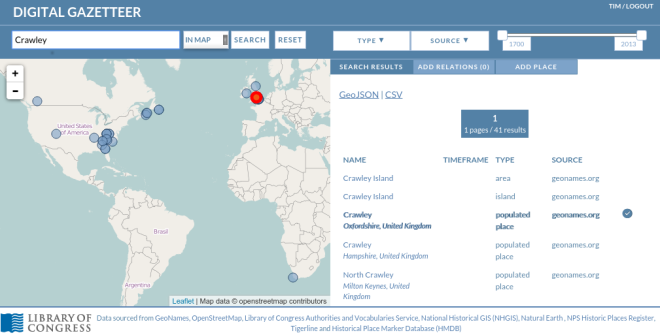
Fig 1. Library of Congress Gazetteer
Architecture
* JSON API
* Backbone.js frontend
* Django
* ElasticSearch as revision enabled document store
* PostGIS
Data Model
* Simple data model.
* Core properties, name, type, geometry
* Alternate Names, (incl. language and local, colloq etc)
* Administrative hierarchy
* Timeframe
* Relations between places (conflation, between geography and between time, etc
* Edit History, versioning, rollbacks, reverts
Features
Search
* Text search (with wildcard, AND and OR support – Lucene query syntax)
* Temporal search
* Search according to data source and data type
* Search within a geographic bounding box
* Search within the geography of another Place.
* GeoJSON and CSV results
* Search can consider alternate names and administrative boundaries, and address details.
* API search of historical tile layers
* Server side dynamic simplification option for complex polygon results

Fig 2. Gazetteer Text Search

Fig 3. Temporal Search

Fig 4. geographic search
Place
* Place has alternate names and administrative boundaries
* Similar Features search (similar names, distance, type etc)
* Temporal data type with fuzzy upper and lower bounds.
* Display of any associated source raster tile layer (e.g. historical map)
* Full vector editing interface for edit / creation.
* Creation of composite places from union of existing places.
* Full revision history of changes, rollback and rollforward.

Fig 5. Alternate Names

Fig 6. Similar Names

Fig 7. Vector Editing
Relations between places
These are:
* Conflates (A is the same place as B)
* Contains (A contains B spatially)
* Replaces (A is the same as B but over time has changed status, temporal)
* Subsumes (B is incorporated into A and loses independent existence, temporal)
* Comprises (B comprises A if A contains B, along with C,D and E)
We will delve into these relationship concepts later
Site Admin
* GeoDjango administrative pages
* Administrative Boundary operations
* Batch CSV Import of places for create / Update
* Edit feature code definitions
* Edit groups and users and roles etc
* Edit layers (tile layers optionally shown for some features)
* Add / Edit data origin definitions
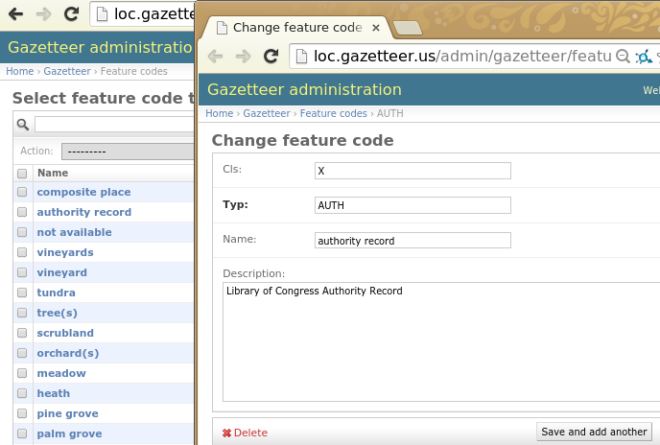
Fig 8. feature code edition
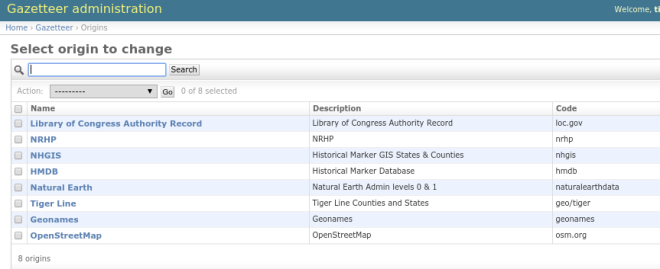
Fig 9. Django origin edition
Background, Requirements and Challenges
Library of Congress and Bibliographic Remediation
The Library has lots of bibliographic metadata, lots of geographic information, much of it historical, almost all of it is unstructured.
For example, they have lots of metadata about books, where it was published, the topics, subjects etc. They want to try and improved the quality of the geo information associated with the metadata, and to augment site search.
So the library needs an authoritative list of places. The Library fully understands the needs for authoritative lists – they have authority files for things, ideas, places, people, files etc, but no centralised listing of them, and where there are geographic records there may be no actual geospatial information about them.
Initial Challenges
So we start with a simple data model, where a named location on the Earth’s surface has a name, a type and a geometry. All very simple right? But actually it’s a complex problem. Take the name of a place, what name to use? What happens if a place has multiple names, and what happens if it has multiple records to describe the same place? Taxonomies are also a large concern, for example establishing a set schema for every different type of feature on the earth is not trivial!
What’s the geometry of a place? Is it a point, is it a polygon, and at what scale? For administrative datasets, it’s often impossible to get a good detailed global administrative dataset. Often in many places the data is not there. Timeframe and temporal gazetteers are an another large area for research (see OpenHistoricalMap.org if this intrigues you!). But the way we describe places in time is very varied, for example “in the 1880’s” or “mid 19th Century” or “1 May 2012 at 3pm”. What about places which are vague or composed of other places, like “The South” (of the US) – how would a gazetteer handle these? And the relationships between places is another very varied research topic.
Approach
So we think the project has tried to address these challenges. For names, the system can accept multiple additional alternate names, and conflation enables the fixing of multiple records together so that the results shows the correct authoritative results. The Digital Gazetteer allows places to have any type of geometry (e.g. point, line, polygon) where all the database needs is a centroid to make search work. For temporal support, places have datestamp for start and end dates but crucially there is in addition fuzzy start and ends specified in days. This enables a place, for example to have a fuzzy start date (sometime in the year 1911) and a clear end date (23 May, 1945). For “The US South” example – composite places were created. The system generates the union of the composite places and makes a new one. The component places still exist – they just have a relationship with their siblings and with their new parent composite place. This brings us to how the Digital Gazetteer handles relations between places.

Fig 10. Composite Place
Relationships
Let’s look a bit more in detail about the relationship model. Basically the relationships between places help in conflation (reducing duplicate records) and in increasing search accuracies. The five relationships are as follows:
* Conflates
* Contains
* Replaces
* Subsumes
* Comprises
Conflates
This is the most common relationship between records initially. It effectively is an ontological statement that the place in one record is the same as described in another record, that entries A and B are the same place. It’s a spatial or a name type of relation. For example, if we had 5 records for Statue of Liberties, and all 4 were conflated to the one record, when you searched for the statue you’d get the one record, but with a link to each of the other four. Conflates hides the conflated record from search results.
Contains
Contains is a geographical relationship. Quite simply, Place A contains Place B. So for example, the town of Brighton would contain the Church St. Matthews.
Replaces
Replaces is mainly a temporal relation, where one place replaces another place if the other place has significantly changed status, name, type or boundary. For example, the building representing the Council Offices of the town from 1830-1967 is replaced by a bank.
Subsumes
Subsumes is mainly a temporal relation. Where a place A becomes incorporated into another place B and loses independent existence. For example, the ward of Ifield which existed from 1780 to 1890 becomes subsumed into the ward of Crawley.
Comprises
Comprises is primarily a spatial or name relation. Place A comprises place B along with place C,D and E. This relation creates composite places, which inherit the geometries of the component places. For example, “The US South” can be considered a composite place. This place is comprised of Virginia, Alabama etc. Virginia in this case comprises “the US South”, and the composite place “The US South” has the union of the geometry of all the places it is comprised by.
Data Sources
OpenStreetMap (OSM), Geonames, US Census Tiger/Line, Natural Earth, Historical Marker Database (HMDB), National Historical GIS (NHGIS), National Register of Historic Places Database (NRHP) and Library of Congress Authority Records
Further Challenges
Automatic Conflation
There remains two main areas for future development and research – Automatic Conflation and Search Ranking. Since there are multiple datasets, there will of course be the same record for the same place. The challenge is how to automatically find the same place from similar records by some kind of search distance. For example, by distance from each other, distance geographically, and in terms of name and place type. Tricky to get right, but the system would be able to undo any of the robots mistakes. Further information about this topic can be found on the GitHub wiki: https://github.com/topomancy/gazetteer/wiki/Conflation
Search Ranking
By default the gazetteer uses full text search which also takes into account alternate names and administrative boundaries, but there is a need to float up the more relevant places in the search results. We can also sort by distance from the search centre if doing a search within geographic bounds, which is used for helping find similar places for conflation. We could probably look at weighting results based on place type, population and area, although population and area for many urban areas in the world may not be available. One of the most promising areas of research is using Wikipedia request logs as a proxy for importance – places could be more important if they are viewed on Wikipedia more than other places.
Further Issues
Some other issues which I haven’t got space to go into here include: synchronising changes up and downstream to and from the various services and datasets. Licensing of the datasets could be looked at especially if they are being combined. What level of participation in the conflation and remediation steps should a gazetteer have, which depends on where the gazetteer is based and who it is being used for.
NYPL Chronology Of Place
I mentioned at the beginning of the post that the New York Public Library (NYPL) was also involved with the development of the Gazetteer. That project was called The Chronology of Place, and as the name suggests is more temporal in nature. But it’s also more focused geographically. Whereas the LoC are interested in the US and the World as a whole, the NYPL’s main focus is the City of New York. They wanted to deep dive into each building of the city, exploring the history and geography of buildings, streets and neighbourhoods.

Fig 11. NYPL Chronology of Place
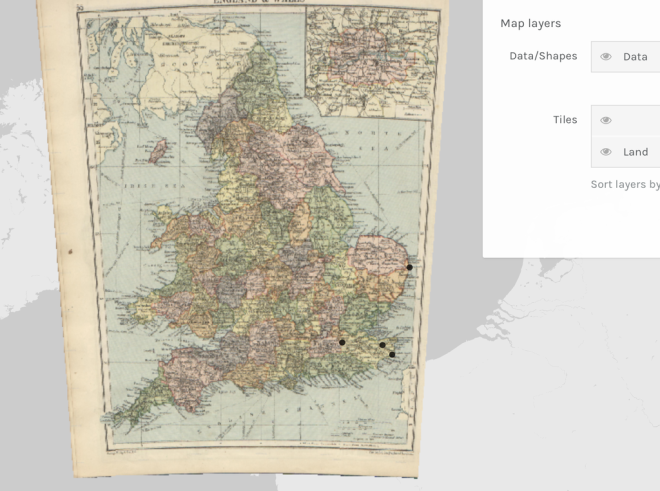
Thus the level of detail was more fine grained, and is reflected in some custom default cartography in the web application client. A nondescript building in a street in a city for example are not usually considered a “place” worthy of a global gazetteer but for the NYPL each building was significant. Also, the NYPL has extensive access to historical maps via the NYPL Map Warper which Topomancy developed for them, and around a hundred thousand digitized vector buildings from these historical map atlases. This data, along with data from the city were able to be added to the system to augment the results. Additional data sources include the Census’s Historical Township boundary datasets, NYC Landmarks Preservation Commission Landmarks and NYC Building Footprints.
There were two additional features added to the application for the NYPL’s Chronology of Place. The first was expanding the data model to include street addresses, so that a building with no name can be used, and the second was to display raster tile layers (often from historical maps) for specific features. Thus,the building features which were digitized from the historical maps were able to be viewed alongside the source raster map that they came from.

Fig 12. Custom/Historical layers shown