LeedsAdultLearning.co.uk

This year, with Leeds City Council I developed LeedsAdultLearning.co.uk which is a course finder for about 300 courses by the City and run by a number of providers and dozens of venues. It offers a range of first step courses for adults, such as basic IT skills, ESOL, caring and crafts. Within the first 24 hours of launch it received over 3000 visits, in the first month, it had over 25,000 visits, with the average user spending three minutes on the site.  The code’s up on my LearningInLeeds GitHub repository.

Screenshot-2017-11-22 Find courses near you in Leeds - Adult Learning in Leeds

The project evolved from a LCC Innovation Lab – similar to the Leodis project I also worked on. The key idea is that it was designed to be a pilot or prototype project, small in scope and quick to develop, it would aim to be an aspirational example of how the City can work with the Council and open data to make good IT products. The adult education department were fully engaged with the development and design of the project, giving feedback, priorities. This engagement was really welcome and I think the experts say its crucial to any successful agile project. The department didn’t have any online course finder before so this was bringing something new, and needed to them.

Screenshot-2017-11-22 Accredited Courses at Swarthmore College - Adult Learning in Leeds

It was featured in the Government Technology News site, the Yorkshire Evening Post, on Made in Leeds TV, and was shown on the big screen in Millennium Square.

Screenshot_2017-11-22_13-45-10

Features

  • Automatic imports of courses from Data Mill North (open data site)
  • Full text search with support for sounds like and spelling mistakes
  • Geographical, near searches
  • Bus and walking directions to the start of the course from any point
  • Add to calendar links for course start
  • Showing courses by topics or categories
  • Responsive and mobile friendly.
  • Simple CMS admin UI for staff to update text pages, change records etc
  • Caching of external API requests, front page and CMS pages
  • Recent searches kept

Technology

  • Ruby on Rails
  • Devise and Active Admin for admin UI
  • Postgresql, PostGIS and pg_search for db, geo, full text stuff
  • Bootstrap for front end user interface layout, CSS etc
  • Transport API, Bing Transit, Mapzen for journey planning and geocoding etc

Future

The project could be altered for other organisations, and it could be altered to include the whole range of courses on offer for adults across the city region. I think usage metrics would need to be done to see what users actually do on the site, and whether the journey planning is useful. Adding extra information about course duration,  how many times a week / month etc would be good. Making it more mobile friendly could be looked at, including making a mobile only app.

The New Cloud Atlas – Mapping the Physical Infrastructure of the Internet

Introduction

The New Cloud Atlas, (newcloudatlas.org) is a global effort to map each data place that makes up the cloud in an open and accountable way. It’s a project to find and map each warehouse data centre, each internet exchange, each connecting cable and switch. Anything of any physical significance in the operation of the cloud should be observed in some way, and recorded for everyone to see and use. Data is stored in OpenStreetMap and users can map things using the on site iD editor with custom telecoms presets for the first time. Map tiles with two styles have been produced and have now made visible this hidden infrastructure. http://newcloudatlas.org

The New Cloud Atlas, named after the nineteenth collaborative scientific data collection project, is about understanding and making visible the hidden “Cloud”. Although most of these telecoms features are in the open and in plain sight, many are missing from open datasets or may be considered sensitive. Telecoms infrastructure has immense importance in connectivity and power in our connected world  – the more connected a place is the more benefits it has. Indeed the lines of fibre optic backbone have become the new ley lines of the 21st Century powering the forces behind a new Psychogeography of places.

A bit about the name: The First Cloud Atlas was published in 1896 by the Permanent Committee of the first International Meterological Congress. Cloud weather observatories around the world were able to share consistent observations of the clouds and observe weather systems whose scale stretched over national boundaries. The publication of the International Cloud Atlas represented a move beyond national concerns and boundaries to an international perspective.

In addition to its important role in the predicting the weather, the vision is a surprisingly early call for infrastructural globalism and worldwide collaboration:

“If there be any branch of science in which work on a uniform system can be especially useful and advantageous, that branch is the inquiry into laws of weather, which, from its very nature, can only be prosecuted with a hope of success by means of very extensive observations embracing large areas, in fact, we might almost say, extending over the whole surface of the globe”

Site

The site shows frequently updated tiles generated from OpenStreetMap(OSM) data, details about the project and a custom OSM editor for making it easier to add map features. Here are some screenshots.

Screen Shot 2016-08-12 at 21.12.33

Map, Transparent Tiles, Markers, Legend


Screen Shot 2016-08-12 at 21.16.25

Cloud X-Ray Style, with scale independent(ish) building polygons

The Cloud X-Ray style, shown above was partially inspired by Kosmtik’s data inspector style, and it shows polygons that are enlarged at low zooms. Polygons should appear to be the same size on the screen as you zoom in. It gives a sci-fi cartography, but I find it very useful finding clusters of mapped features, as all features are shown at all zoom levels.


Screen Shot 2016-08-12 at 21.21.00.png

Custom iD Editor with Telecoms Presets

Note: that you can also edit in JOSM or Vespucci OSM Editors using these presets here: https://simonpoole.github.io/new-cloud-atlas-preset/

Background

The New Cloud Atlas is a project initiated by experimental media technologist, artist and designer Ben Dalton with the design and research studio of Amber Frid-Jimenez and Joe Dahmen, and myself. Ben writes about the project – with the main idea that it’s about understanding what the Internet actually is in physical terms, rather than as something that remains clouded and mysterious:

The first appearance of the internet cloud was in network diagrams. The cloud symbol was used to stand in for complexity. The cloud embodied something of the way that the internet functions. The internet was designed to be ‘end-to-end’, so computers are meant to be able to connect to each other without interference as the message passes through a network of interconnections. Only the end points are meant to matter. The clouds here represent ‘something in the middle that is too complex to draw here’, a kind of neutral space through which information passes. It is an act of simplification, but it also contains an implicit statement that ‘the cloud will look after itself’ that this thing is going to carry on being there.

Beclouding is deliberately making something more confusing, in order to obfuscate or conceal its meaning. The use of the cloud has shifted in digital systems. The idea that ‘this is too complicated to think about’ has been moved front and centre and converted into a business model, shedding its innocence along the way. Through a sleight of hand, the cloud sometimes appears as a platform, and sometimes a material. This narrative rests on the idea that the services are to be trusted, and they can take care of themselves on your behalf. We trust them with our emails and our childhood photographs and our meeting plans and whatever else we use the cloud for. In this new definition of the cloud, there is a statement that ‘this is too complex to deconstruct or critique’. You shouldn’t try to look in to the cloud and see what’s there. It’s made up of vapour, and it’s not to be interrogated. Better to simply observe it from a distance and admire it at sunset.

Once the domain of national governments, information infrastructure is increasingly constructed, operated, and maintained by major multinational corporations. These corporations, which include Google, Facebook, Amazon, Apple, and Microsoft, have a similar vested interest in maintaining control over of the flow of goods and information once exercised by national governments, but a reach at once more extensive and less transparent.

Psychogeography

Regular readers may know of my interest in Psychogeography. The British Psychogeography of the 90s employed Ley Lines and “Magico-Marxism” using the language of the occult to explain the unknown forces of power at work in space and in places. I’m developing the idea that the new lines of power in the 21st Century are of Information – and the actual lines of light that transmit these bits of data, and the buildings that house them. More about that in walk or talk later on this year!

Another more obvious connection with psychogeography is the hidden in plain sight angle. These passageways of the internet are often marked, on manhole covers, in mobile phone masts, in big buildings in light industrial estates, but they are utterly overlooked. They may travel along the margins, along canals or train tracks. They are also sited in classic psychogeographical “liminal” spaces – beaches, margins of rural and urban, wasteland, on top of tower buildings etc.

OpenStreetMap and the Telecoms WikiProject

OpenStreetMap allows anything that exists and can be verified to be mapped. There is no notability rule that Wikipedia has, for example. So it allows manhole covers to be mapped in detail, it allows telephone lines and the assorted street cabinet boxes that crowd our pavements. You might get feedback as to how to map these features and you might get funny comments about why these features are being mapped (and indeed, mapping with OpenStreetMap is voluntary!) but pretty much all OSM mappers will agree that these features shouldn’t be excluded.

Telecoms features in OpenStreetMap haven’t been well mapped before. This is both good and bad in that the taxonomy (or folksonomy to be more accurate)  – the tags that describe these features -have not been standardized. We have the opportunity to define the tags, or at least standardize some of them to be more consistent across similar telecoms infrastructure features.

I started WikiProject Telecoms on the OSM Wiki, so please go there to see how to map and tag features – and if you are a telecoms, mapping or tagging specialist please suggest better ways to map these features! https://wiki.openstreetmap.org/wiki/WikiProject_Telecoms

The current features being rendered in the New Cloud Atlas map are:

  • Data Centres
  • Telephone Exchanges
  • Manhole covers
  • Telephone poles and wires
  • Submarine cables etc
  • Telecoms towers, masts, and antennae
  • Street Cabinets

Underground features may be more difficult to map – so we are relying on manhole covers which often show what its use and who operates the cable underneath (in the UK at least) – and those markings sprayed by utility companies, and some data imports. If you don’t know where an underground cable goes its probably best to leave it out.

You might have noticed that many of the options include sound and heat for the street cabinets. One of the side effects of today’s modern fibre optic street cabinets is that they are often installed with more power needs than copper wire ones – and so they need a fan. Often the cabinets are warm to the touch and sometimes they make a quite loud drone sound. This type of data can be useful, I have heard, to people who are vision impaired. Sound and touch can help orientate people in space.

Update: There is a JOSM Preset and a Vespucci Preset that Simon Poole developed

Open Data / Secrecy etc

It’s probably worth talking a little bit about the privacy and secrecy issues. Although the project isn’t about getting releases of data from companies and governments, and it’s not about uncovering the secret installations, it is about collaboratively mapping the world. Almost all of the information that will make up the New Cloud Atlas will be found in the field or in public information sources.

You may be reminded of a story in 2003 (2 years after 9/11) of Sean Gorman‘s PhD dissertation that the US Government wanted to make classified as although it contained only publicly available information (about the Internet connections in the US) he analyzed the data to identify the weak links – weaknesses that, for example, a disaster could take out or a terrorist could exploit.  Officials in the US Govt said that his dissertation should be burnt! Sean successfully graduated and started a mapping company with the DHS as clients. (I actually ended up working there at FortiusOne / GeoIQ several years after that for a bit). Now of course open data and open analysis is encouraged and promoted by governments (and following this trend check out Sean’s new startup Timbr.io).

You may also recall stories about how many national mapping agencies removed military bases (such as Aldermaston, or Greenham Common in the UK) from their paper maps – even when these bases were signed from the motorways and major roads and had nice big clear signs outside the fences.  A relic from the Cold War, perhaps. It appears to me that even in this current year the Ordnance Survey mislabels the Menwith Hill USAF/RAF Listening Base in North Yorkshire as just “Menwith Camp” with no indication of it’s real name, activity nor landuse (as compared to OpenStreetMap for example).

At this point, if you are curious, we should evoke the classic 1996 Wired Article by Neal Stephenson: Mother Earth Mother Board http://www.wired.com/1996/12/ffglass/ It’s essential if you are interested in reading more about the geo political and technology of international internet cable laying. It’s also a great read in general.


Liverpool Walk / Workshop

Ben and I ran a series of walks and workshops at FACT in June 2016. Cloud Dowsing Hunting for the Hidden Internet and Mapping the New Cloud Atlas

We used FieldPapers to give to participants and mappers and went around the streets of Liverpool.

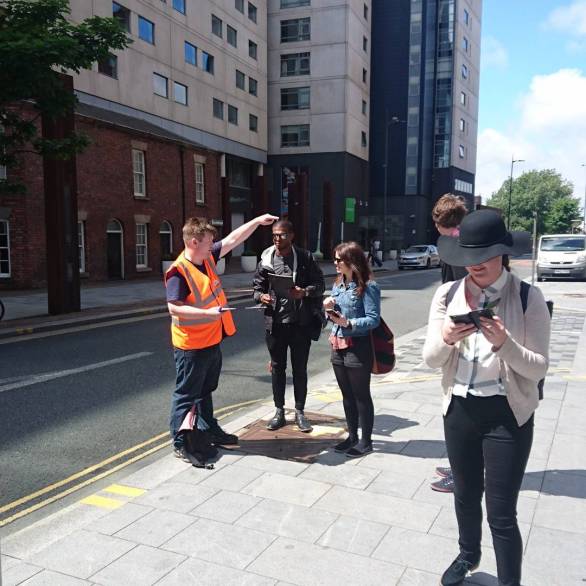
Here we are near the main telephone exchange and data centre looking for manhole covers, cabinets and antennae, that’s me pointing.

13391350_1053402384736248_1279453524_n

You can view the photos I took on the Flickr Album https://www.flickr.com/photos/chippee/sets/72157671540933095


Development Notes

Code for the site is on github: https://github.com/timwaters/new_cloud_atlas

Mapnik / Kosmtik Style file and processing notes also on github: https://github.com/timwaters/cloud_mapping

Mapnik X-Ray Style

Of possible interest to mapnik style geeks could be the use of the scale denominator and PostGIS ST_Scale commands to scale up building polygons so that they appear to be the same size regardless of the zoom. If anyone wants to fix this to make it work better, please let me know!

select st_translate(st_scale(way, (!scale_denominator! * 0.00028) - (5 - z(!scale_denominator!)) ,
 (!scale_denominator! * 0.00028) - (5 - z(!scale_denominator!)) ), 
st_x(st_centroid(way))*(1-( (!scale_denominator! * 0.00028) - (5 - z(!scale_denominator!)) )), 
st_y(st_centroid(way))*(1-( (!scale_denominator! * 0.00028) - (5 - z(!scale_denominator!)) ))) as way,
 building AS type FROM planet_osm_polygon WHERE (building='data_center' ) AS data",

OSM Tile Generation

Tiles are kept up to date at around 15 minutes with the central OSM database. Occasionally a full planet import is done. I think I could use Lua scripting to ensure that the database remains lean. The system uses TileStache to enable the UTFGrids for the popups. Essentially we filter out a lot of stuff from the OSM database:

  1. Convert an osm.pbf file to an o5m file
    ./osmconvert  planet-latest.osm.pbf -o=planet.o5m
  2.  Filter the o5m file to an .osm file
    ./osmfilter planet.o5m --parameter-file=cloud_mapping/osmfilter_params.txt > planet.filtered.osm
  3. Import the .osm file into the database using the custom osm2pgsql Style
     osm2pgsql --slim -d gis planet.filtered.osm -S cloud_mapping/default.style
  4. Set up replication using Osmosis and osm2pgsql to get changes from OSM db
    osmosis --read-replication-interval  --simplify-change --write-xml-change changes.osc.gz
    osm2pgsql -d gis -S default.style -s -C 800 -a changes.osc.gz -e10-19 -o expire_e10-19.list

http://newcloudatlas.org/

Colliding The Mental Maps of Edinburgh with Mapwarper.net

Last autumn I popped up to Edinburgh from the North of England for State of the Map Scotland conference. Together with Edinburgh College of Art in Evolution House participants took part in series of workshops “Map.Makars”

I took part in a memory map of the city. The rules were: no looking at other maps, the map should include the venue, the castle, the train station. We drew, from memory the city on large pieces of paper. Gregory scanned/photographed these and put these on mapwarper.net to stretch them to fit. he then combined these together with an interactive and animated transparency control to create the Hand Drawn Map Collider “No-map Map Give it a whirl! http://www.livingwithdragons.com/maps/nomap-map/

Screenshot from 2016-04-22 11:26:11.png

My map, in case you were wondering was possibly the least accurate of them, coming from furthest away! http://mapwarper.net/maps/10907

Screenshot from 2016-04-22 11:28:00.png


A Digital Gazetteer of Places for the Library of Congress and the NYPL

I’m proud to tell you that the project I worked on last year with Topomancy for the Library of Congress and the New York Public Library has just been released to the Internet. It’s an open source, fast, temporal enabled, versioned gazetteer using open data. It also works as a platform for a fully featured function-laden historical gazetteer.

You can check out the official release at the Library of Congress’s GitHub page, and for issues, documentation and development branches on Topomancy’s Gazetteer project site.

Here is an introduction to the project giving an overview and discussion of the challenges and listing the features of this software application. Enjoy!

DEMO: Head over to http://loc.gazetteer.us/ for the Digital Gazetteer – a more global gazetteer and to http://nypl.gazetteer.us/ for the NYPL’s  NYC focused historic gazetteer. If you want to try out the conflation, remediation and administrative roles, let us know at team@topomancy.com

Introduction, Overview, Features

A gazetteer is a geographic dictionary sometimes found as an index to an atlas. It’s a geographic search engine for named places in the world. This application is a temporal gazetteer with data source remediation, relations between places and with revisions which works with many different data sources. It’s fast, written in Python and uses ElasticSearch as a database. The application was primarily written as a Digital Gazetteer for the Library of Congress’s search and bibliographic geographic remediation needs and was also developed for the New York Public Library’s Chronology of Place project. It is currently being used in production by the Library of Congress to augment their search services. The software is MIT licensed.
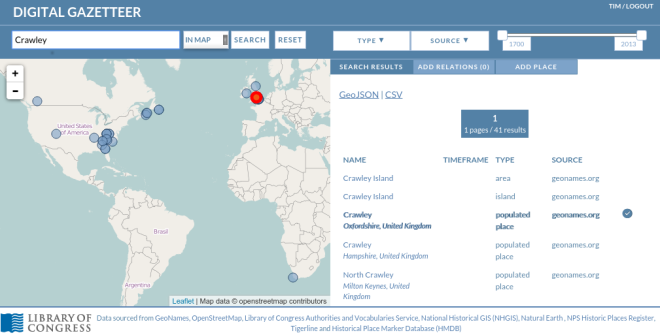
Fig 1. Library of Congress Gazetteer

Fig 1. Library of Congress Gazetteer

Architecture

* JSON API
* Backbone.js frontend
* Django
* ElasticSearch as revision enabled document store
* PostGIS

Data Model

* Simple data model.
* Core properties, name, type, geometry
* Alternate Names, (incl. language and local, colloq etc)
* Administrative hierarchy
* Timeframe
* Relations between places (conflation, between geography and between time, etc
* Edit History, versioning, rollbacks, reverts

Features

Search

* Text search (with wildcard, AND and OR support – Lucene query syntax)
* Temporal search
* Search according to data source and data type
* Search within a geographic bounding box
* Search within the geography of another Place.
* GeoJSON and CSV results
* Search can consider alternate names and administrative boundaries, and address details.
* API search of historical tile layers
* Server side dynamic simplification option for complex polygon results

Fig 2. Gazetteer Text Search

Fig 2. Gazetteer Text Search

Fig 3. Temporal Search

Fig 3. Temporal Search

Fig 4. geographic search

Fig 4. geographic search

Place

* Place has alternate names and administrative boundaries
* Similar Features search (similar names, distance, type etc)
* Temporal data type with fuzzy upper and lower bounds.
* Display of any associated source raster tile layer (e.g. historical map)
* Full vector editing interface for edit / creation.
* Creation of composite places from union of existing places.
* Full revision history of changes, rollback and rollforward.

Fig 5. Alternate Names

Fig 5. Alternate Names

Fig 6. Similar Names

Fig 6. Similar Names

Fig 7. Vector Editing

Fig 7. Vector Editing

Relations between places

These are:
* Conflates (A is the same place as B)
* Contains (A contains B spatially)
* Replaces (A is the same as B but over time has changed status, temporal)
* Subsumes (B is incorporated into A and loses independent existence, temporal)
* Comprises (B comprises A if A contains B, along with C,D and E)

We will delve into these relationship concepts later

Site Admin

* GeoDjango administrative pages
* Administrative Boundary operations
* Batch CSV Import of places for create / Update
* Edit feature code definitions
* Edit groups and users and roles etc
* Edit layers (tile layers optionally shown for some features)
* Add / Edit data origin definitions
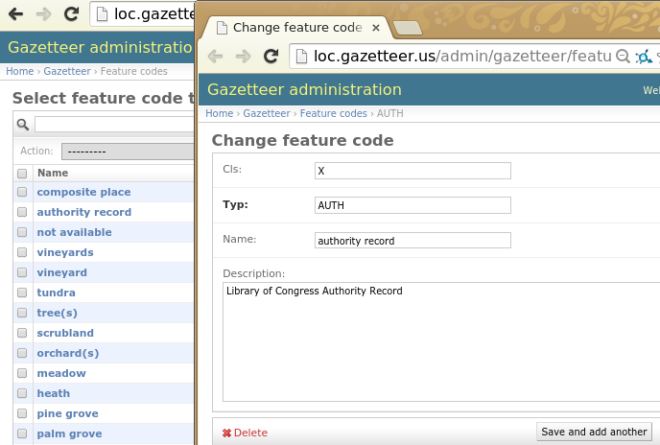
Fig 8. feature code edition
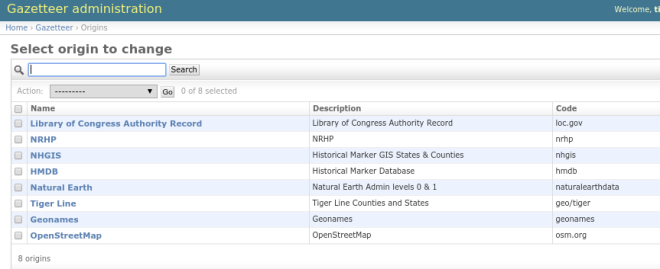
Fig 8. feature code edition

Fig 9. Django origin edition

Fig 9. Django origin edition

Background, Requirements and Challenges

Library of Congress and Bibliographic Remediation

The Library has lots of bibliographic metadata, lots of geographic information, much of it historical, almost all of it is unstructured.
For example, they have lots of metadata about books, where it was published, the topics, subjects etc. They want to try and improved the quality of the geo information associated with the metadata, and to augment site search.

So the library needs an authoritative list of places. The Library fully understands the needs for authoritative lists – they have authority files for things, ideas, places, people, files etc, but no centralised listing of them, and where there are geographic records there may be no actual geospatial information about them.

Initial Challenges

So we start with a simple data model, where a named location on the Earth’s surface has a name, a type and a geometry. All very simple right? But actually it’s a complex problem. Take the name of a place, what name to use? What happens if a place has multiple names, and what happens if it has multiple records to describe the same place? Taxonomies are also a large concern, for example establishing a set schema for every different type of feature on the earth is not trivial!

What’s the geometry of a place? Is it a point, is it a polygon, and at what scale? For administrative datasets, it’s often impossible to get a good detailed global administrative dataset. Often in many places the data is not there. Timeframe and temporal gazetteers are an another large area for research (see OpenHistoricalMap.org if this intrigues you!). But the way we describe places in time is very varied, for example “in the 1880’s” or “mid 19th Century” or “1 May 2012 at 3pm”. What about places which are vague or composed of other places, like “The South” (of the US) – how would a gazetteer handle these? And the relationships between places is another very varied research topic.

Approach

So we think the project has tried to address these challenges. For names, the system can accept multiple additional alternate names, and conflation enables the fixing of multiple records together so that the results shows the correct authoritative results. The Digital Gazetteer allows places to have any type of geometry (e.g. point, line, polygon) where all the database needs is a centroid to make search work. For temporal support, places have datestamp for start and end dates but crucially there is in addition fuzzy start and ends specified in days. This enables a place, for example to have a fuzzy start date (sometime in the year 1911) and a clear end date (23 May, 1945). For “The US South” example – composite places were created. The system generates the union of the composite places and makes a new one. The component places still exist – they just have a relationship with their siblings and with their new parent composite place. This brings us to how the Digital Gazetteer handles relations between places.

Fig 10. Composite Place

Fig 10. Composite Place

Relationships

Let’s look a bit more in detail about the relationship model. Basically the relationships between places help in conflation (reducing duplicate records) and in increasing search accuracies. The five relationships are as follows:

* Conflates
* Contains
* Replaces
* Subsumes
* Comprises

Conflates

This is the most common relationship between records initially. It effectively is an ontological statement that the place in one record is the same as described in another record, that entries A and B are the same place. It’s a spatial or a name type of relation. For example, if we had 5 records for Statue of Liberties, and all 4 were conflated to the one record, when you searched for the statue you’d get the one record, but with a link to each of the other four. Conflates hides the conflated record from search results.

Contains

Contains is a geographical relationship. Quite simply, Place A contains Place B. So for example, the town of Brighton would contain the Church St. Matthews.

Replaces

Replaces is mainly a temporal relation, where one place replaces another place if the other place has significantly changed status, name, type or boundary. For example, the building representing the Council Offices of the town from 1830-1967 is replaced by a bank.

Subsumes

Subsumes is mainly a temporal relation. Where a place A becomes incorporated into another place B and loses independent existence. For example, the ward of Ifield which existed from 1780 to 1890 becomes subsumed into the ward of Crawley.

Comprises

Comprises is primarily a spatial or name relation. Place A comprises place B along with place C,D and E. This relation creates composite places, which inherit the geometries of the component places. For example, “The US South” can be considered a composite place. This place is comprised of Virginia, Alabama etc. Virginia in this case comprises “the US South”, and the composite place “The US South” has the union of the geometry of all the places it is comprised by.

Data Sources

OpenStreetMap (OSM), Geonames, US Census Tiger/Line, Natural Earth, Historical Marker Database (HMDB), National Historical GIS (NHGIS), National Register of Historic Places Database (NRHP) and Library of Congress Authority Records

Further Challenges

Automatic Conflation

There remains two main areas for future development and research – Automatic Conflation and Search Ranking. Since there are multiple datasets, there will of course be the same record for the same place. The challenge is how to automatically find the same place from similar records by some kind of search distance. For example, by distance from each other, distance geographically, and in terms of name and place type. Tricky to get right, but the system would be able to undo any of the robots mistakes. Further information about this topic can be found on the GitHub wiki: https://github.com/topomancy/gazetteer/wiki/Conflation

Search Ranking

By default the gazetteer uses full text search which also takes into account alternate names and administrative boundaries, but there is a need to float up the more relevant places in the search results. We can also sort by distance from the search centre if doing a search within geographic bounds, which is used for helping find similar places for conflation. We could probably look at weighting results based on place type, population and area, although population and area for many urban areas in the world may not be available. One of the most promising areas of research is using Wikipedia request logs as a proxy for importance – places could be more important if they are viewed on Wikipedia more than other places.

Further Issues

Some other issues which I haven’t got space to go into here include: synchronising changes up and downstream to and from the various services and datasets. Licensing of the datasets could be looked at especially if they are being combined. What level of participation in the conflation and remediation steps should a gazetteer have, which depends on where the gazetteer is based and who it is being used for.

NYPL Chronology Of Place

I mentioned at the beginning of the post that the New York Public Library (NYPL) was also involved with the development of the Gazetteer. That project was called The Chronology of Place, and as the name suggests is more temporal in nature. But it’s also more focused geographically. Whereas the LoC are interested in the US and the World as a whole, the NYPL’s main focus is the City of New York. They wanted to deep dive into each building of the city, exploring the history and geography of buildings, streets and neighbourhoods.

Fig 11. NYPL Chronology of Place

Fig 11. NYPL Chronology of Place

Thus the level of detail was more fine grained, and is reflected in some custom default cartography in the web application client. A nondescript building in a street in a city for example are not usually considered a “place” worthy of a global gazetteer but for the NYPL each building was significant. Also, the NYPL has extensive access to historical maps via the NYPL Map Warper which Topomancy developed for them, and around a hundred thousand digitized vector buildings from these historical map atlases. This data, along with data from the city were able to be added to the system to augment the results. Additional data sources include the Census’s Historical Township boundary datasets, NYC Landmarks Preservation Commission Landmarks and NYC Building Footprints.

There were two additional features added to the application for the NYPL’s Chronology of Place. The first was expanding the data model to include street addresses, so that a building with no name can be used, and the second was to display raster tile layers (often from historical maps) for specific features. Thus,the building features which were digitized from the historical maps were able to be viewed alongside the source raster map that they came from.

Fig 12. Custom/Historical layers shown

Fig 12. Custom/Historical layers shown

State of the Map Europe 2014 – Pure OpenStreetMap.

Karlsruhe

State of the Map Europe 2014 was in the German city of Karlsruhe. The city was a planned city – designed and built around 1715 – pre motor car, but with wide avenues, and half of the city seems to be a park. It’s also famous for being the home of the Karlsruhe Addressing Scheme – an example of a folksonomy tagging convention that everyone pointed to and adopted, due to the great mappers there – including the folks from Geofabrik.de who also organised the conference. Here are some notes from the conference:

Nature of the conference

The European conference seemed much more intimate with a focus on developer and contributors  – compared to the US Conference which I think had more end users and people sent there by their bosses for their company. Pretty much every single session was on topic (except for the closing buzzword laden keynote!)  – and as such there were no enlightening talks about psychogeography, general historical mapping, or other geospatial software. It was pure OSM.

All the talks are online and the video recordings are on youtube and I encourage you to view them.

3D maps

3D Maps, such as Mapzen and OSMBuildings were prominent – and both showed off some very creative ways of representing 3D maps.

Geocoder and Gazetteers

The only track in the conference – this was full of gazetteers with an announcement from OpenCage and MapZen – all appear to be using ElasticSearch – same as we (Topomancy) did last year for the NYPL and Library of Congress. Check out gazetteer here.

Other stuff

Trees – Jerry did a talk about mapping trees – about how they were represented in historical maps previously, and how we can use SVG symbols to display woods and trees in a better way. Jerry lead an expedition and workshop on the morning of the hack day to show participants the different habitats, surface types and variance in the environment that mappers could take into consideration.

Mapbox WebGL – Constantine, a European engineer of Mapbox did a fascinating talk about the complexities of the technical challenges with vector tiles and 3D maps. I really enjoyed the talk.

Image

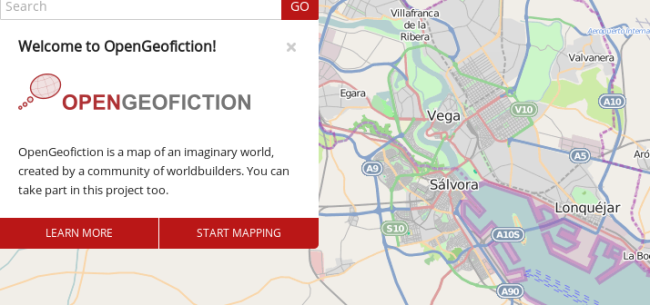
OpenGeoFiction – using the OSM stack to create fictional worlds  – not fantasy or science fiction, but amazing experiments in amateur planning, utopian visions and creative map making. OpenGeoFiction.net

The fictional world of Opengeofiction is thought to be in modern times. So it doesn’t have orcs or elves, but rather power plants, motorways and housing projects. But also picturesque old towns, beautiful national parks and lonely beaches.

I love this project!

Vector Tiles – Andy Allan talked about his new vector tile software solution ThunderForest – being one of the only people to know the ins and outs of how Mapbox do the Mapnik / TileMill vector magic. ThunderForest powers the cycle map. Vector maps has lots of advantages and I think we’d probably use it for OpenHistoricalMap purposes at some stage. Contact Andy for your vector mapping and online cartographic needs!

POI Checker – from the same house as WheelMap.org comes POI Checker – it allows organisations to compare their data with data in OSM  – and gives a very neat diff view of Points of Interests. This could be a good project to follow.

Historical Stuff

OpenHistoricalMap There were a few things about historical maps in the conference, although in my opinion less than at any other SOTM previously. I did a lightning talk about OpenHistoricalMap and completely failed to mention the cool custom UK centric version of the NYPL’s Building Inspector.

Opening Keynote  – this was peppered with the history of the city and gave a number of beautiful historical map examples. Watch the video.

Map Roulette v2 – Serge gave a talk about the new version of Map Roulette  – it is being customised to be able to run almost any custom task on the system. We chatted a the hack day to see if the tasks from the Building Inspector could be a good fit into the new Map Roulette – I will look into this!


Leeds Data Thing, Maps and Hackdays

Leeds Data Thing is a new group started in Leeds  (not to be confused with Leeds Ruby Thing!).

I spoke at the first event (read the write up from Rebecca) about Geospatial visualisations and  OpenStreetMap: Here are the slides:

Since then there has been a few other events as part of Big Data Week – including a load of great short talks.

This weekend there was a data hackday at the UK’s NHS Information Centre for Health and Social Care in the centre of Leeds.

hipster photo

There’s a wealth of data on their website , but it was given to us as a mysql database, and we were able to enter remotely. On the first day I poked around the data and had a thought.

Hackdays

I often spend the first part of any hackday wondering what to do, and twiddling thumbs. I find that hackdays become for me a type of busman’s holiday – and this hackday was particularly geographical in nature. Most of the entries had some kind of data on map component. I think that these types of analyses, whilst being very smart and interesting – and may be exactly what the judges are looking for, may not exactly stretch the unexpected or “the hack” in the data.

Fortunately there was plenty of latitude for exploring things laterally. The most interesting dataset was listing the chemicals and drugs each practice spent money on – but I couldn’t find much to do with it.   What caught my eye was the dataset listing the names of the doctors surgeries, practices, medical centres. If I think about my neighbourhood I can pass about half a dozen doctors in a very small area. Leeds is well covered (or perhaps just my area is!) . I was reminded of James Joyce’s quote about being unable to cross Dublin without passing a pub. Perhaps the same can be said for Leeds and doctors!  The names of the surgeries were also interesting. Names such as:

Chapeloak Surgery
The Avenue Surgery
Dr Ca Hicks’ Practice
The Dekeyser Group Practice
The Highfield Medical Centre
Chapeltown Family Surgery

Wonder if the more “leafy” the name, the more “leafy” the neighbourhood it was in? Perhaps the more grandiose sounding practices had more patients? Perhaps the smaller sounding ones had better patient satisfaction reviews?

At the venue, it appeared that I was the only one to be using Linux on the desktop and so the wifi did not work – so I had a bit over one hour to put something together. Decided to go with the concept of “Leeds is covered” and wanted something showing the labels of the practices over the areas where they were. Filling out the map, so to speak.  The hack was called “Tim’s One Hour Data Challenge” and here is the end result:

Leeds is covered

WherecampUK 2010 Recap

Last week I journeyed down on the train to Nottingham to go to WhereCampUK – an unconference for all things “geo” – but it was only a few months since the similarly named WhereCampEU of (which I never actually wrote something about) down in London. Before I share some of the best bits, here’s some of the similarities and differences.

* Less international folks

* Less big geo personalities and keynotes

* More OSM

* No T-Shirts

* More beer – we drank a large pub dry, literally. The next day, the landlord swore at me for pissing off their regulars.

* More cake

* Cheaper and quicker to run, setup and organise.

For more pointers in how to run an unconference, check out Steve Coast‘s latest post, where he writes about what he did for Wherecamp in Denver.  How I ran a successful unconference in 6 hours and you can too.

Overall, the event was great.

I ran two sessions. The main one was “What is Psychogeography“. The best part of this was sending all participants out with directions in twos and threes, for 10 mins before lunch. They had directions such as “left left right”, “follow someone”, “ask where the centre is, follow that direction, ask again”, “find hidden portals”, “find fairies”, “hear something, take a photo”.

I also quickly slotted in the NYPL Warper presentation, and included this slide. You get 20 points if you know what this refers to!

I also mentioned the words “neogeography” for the first time in the conference, and that was at 3:30pm, which says quite a bit about the use of the term.

Talks I liked were:

* Vernacular Geography & Informal Placenames

* Geo Games

* Education and mobile maps

* Augmented Reality roundup

* How streets get names

* Peoples Collection Wales

* Haptic Navigation

* OSM Talks including – Potlatch 2

* Gregory Mahler’s – I’m a Psycho Mapper!

* OSGEO


WhooTS a small wms to tile proxy – WMS in Potlatch

WhooTS is a small and simple wms to tiles proxy / redirect system.

Essentially it enables the use of WMS in applications that only accept Tiles (google / Openstreetmap scheme) – WMS is now in Potlatch!

How to use it?

http://whoots.mapwarper.net/tms/z/x/y/{layer}/http://path.to.wms.server

Example:

a mapwarper map:

http://whoots.mapwarper.net/tms/!/!/!/2013/http://warper.geothings.
net/maps/wms/2013

viewing it in Potlatch, the OpenStreetMap editor:

Goes to:

Caveats:

Its’s quite simple, does not do any caching, it just redirects a tile url to an equivalent WMS request. It would only work with WMS servers that accept EPSG:900913 projections, and at the moment, it outputs OSM / Google Tile scheme, not a proper TMS tile scheme.

It’s written in Ruby with the Sinatra micro web application framework. The code is available on GitHub too. http://github.com/timwaters/whoots

Settle Mapping Party, Sat 15th May

Here follows a blog post that’s written like a press release, sorry.

A group of volunteers from around the North of England on Saturday 15th May 2010, will attempt to map the entire North Yorkshire town, from every street, bridge, footpath and chip shop – in order to create a free and open map of the town. All welcome, no experience or technology required!

The Association for Geographic Informations Northern Group and the OpenStreetMap Foundation are running a mapping party – a cross between an informal fieldtrip and a hands on workshop. OpenStreetMap is the wikipedia of maps – it’s open, free and anyone can edit and contribute.

Organiser Tim Waters said: “OSM aims to create free geographic data, like street maps, that can be used by anyone, anywhere, and over the Saturday we aim to have a complete map of the streets of Settle and many other features in the town.”

With the announcement of the Ordnance Survey releasing a lot of mid scale mapping data for free, the chances of having a top notch detailed map is greater than ever. By making a free and open map, anyone can edit and correct details, making sure the map stays up to date and relevant. It’s also free to copy and change and distribute, which is impossible to do with almost every other map.

Anyone and everyone is welcome to attend, families and children are also welcome! No previous experience needed, and no GPS units needed either. GPS units will be available for people to borrow, but people can contribute a lot by using a pen and paper. It’s an open organisation with no membership requirements.

People will start assembling at 10 – 10:30 a.m at Ye Olde Naked Man cafe in Settle’s central Market Place, and spend the morning mapping the area. Then they will come back and have some lunch, meeting at 1pm at Thirteen Cafe Bar and either head out again to fill in the gaps, or start editing their notes into the map system. The day comes to an end around half 3pm to 5pm, where volunteers recap on the days mapping, and have a natter over a pint of beer

More information to sign up:

http://wiki.openstreetmap.org/wiki/Settle_Mapping_Party

http://www.agi.org.uk/north/

OSM Slides At AGI North.

Yesterday for the AGI Northern Group I talked about OpenStreetMap, with a focus on how to use, contribute. About the tools, services and people that surround the project. There were two talks, an OSM talk and a MapAction talk. We had a good turn out.

It touched upon the new Ordnance Survey OpenData and it’s impact on OSM, and how we may change the way map in the UK, and then I talked about Haiti too – how what we did “changed disaster response forever” – but only briefly as Anne-Marie Frankland from MapAction gave a great presentation about her work in Haiti, she was one of the first to deploy to the area. Really astonishing and inspiring work they did over there. Hope to be able to see those slides later.

In case you were wondering, MapAction send volunteers out at the very early days of a crisis to provide mapping support and services to responders. During Haiti they produced maps, installed data on GPS devices, trained search and rescue teams how to use them, produced search and rescue sector maps, locational awareness maps, helped identify locations for camps, and a whole host of other things, with not much sleep.

My slides can be found here: http://geothings.net/presentations/osm_agi_north_april2010.ppt

and also at slideshare.net and below